Finished Goods Inventory Management: Best Practices for Manufacturers
Introduction
Picture this: your warehouse holds $500,000 worth of finished products, yet you’re struggling with cash flow. Meanwhile, key customers face stock-outs on fast-moving items while slow movers gather dust. This scenario plays out daily in manufacturing facilities worldwide. Finished goods inventory represents your largest working capital investment and directly impacts both customer satisfaction and profitability. The difference between effective and poor finished goods management can mean the difference between thriving and merely surviving. This guide reveals the financial impact, proven best practices, and technology strategies that transform finished goods from a cost center into a competitive advantage.
What Is Finished Goods Inventory?
Finished goods inventory consists of products that have completed the manufacturing process and are ready for sale to customers. These items represent the final stage in your production workflow, having progressed through two earlier phases: raw materials (the inputs you purchase) and work-in-progress or WIP (partially completed items still in production).
From a financial perspective, finished goods appear as a current asset on your balance sheet because you expect to convert them to cash within 12 months through sales. This inventory typically represents your largest single inventory investment, as it includes not only the cost of raw materials but also all the labor, overhead, and processing expenses accumulated during manufacturing.
For context, manufacturing businesses average approximately 5.3 inventory turns annually, according to Netstock’s analysis of 2,400+ small and medium manufacturers. This means the typical manufacturer sells and replaces their entire finished goods inventory roughly five times per year. Companies with higher turnover ratios generally manage inventory more efficiently, converting products to cash more quickly.
Examples of finished goods span every industry. An electronics manufacturer’s finished goods include smartphones ready for shipment. A furniture maker’s finished goods are assembled chairs packaged for delivery. A food producer’s finished goods are packaged items ready for grocery store shelves. In each case, these products require no additional manufacturing work before sale, they simply need distribution to reach customers.
Why Finished Goods Management Matters More Than You Think
Direct Impact on Cash Flow
Every dollar tied up in finished goods inventory is capital unavailable for other business operations. When you manufacture a product and place it in storage, you’ve already paid for materials, labor, and overhead, but you haven’t yet received payment from customers. This gap creates working capital pressure that many manufacturers underestimate.
Industry reality compounds this challenge. Currently, 76% of manufacturing and supply chain operations face labor shortages, making efficient capital deployment more critical than ever. You need available funds to compete for talent, invest in automation, and respond to market opportunities.
The numbers tell a compelling story. Holding costs for inventory typically range from 20% to 30% of inventory value annually. These costs include warehouse space, insurance, potential obsolescence, opportunity cost of capital, and handling expenses. This means $100,000 in excess finished goods inventory costs your business $20,000 to $30,000 per year in holding expenses alone.
Customer Satisfaction Depends on Availability
Customer expectations have evolved dramatically. Same-day or next-day shipping has shifted from premium service to baseline expectation in many markets. When customers want your product and you have stock-outs, they don’t wait patiently, they buy from competitors.
Research demonstrates that manufacturers implementing automated inventory systems improve on-time delivery performance by 25%. This reliability enhancement generates compounding benefits through improved customer retention and reduced expediting costs for rushed shipments to cover shortages.
The challenge lies in striking the right balance. Maintaining enough inventory to meet demand without tying up excessive capital requires data-driven decision-making rather than guesswork.
Obsolescence Risk Increases Over Time
Products don’t maintain their value indefinitely. Technology advances, customer preferences shift, and competitors introduce better alternatives. The longer finished goods sit in your warehouse, the higher the risk they’ll lose value through obsolescence.
Consider an electronics manufacturer operating with six-month product cycles. Inventory produced today might face steep discounting or complete write-offs if still unsold six months from now. Food manufacturers face even tighter timelines with expiration dates creating hard deadlines for inventory movement.
Effective finished goods management requires understanding product lifecycles and adjusting inventory levels accordingly. Fast-moving, stable products justify higher inventory positions while products nearing end-of-life require careful runoff management.
The Critical Formula: Calculating Finished Goods Inventory
Understanding your finished goods inventory value enables data-driven decision-making about production schedules, purchasing, and cash management. The calculation follows a straightforward formula:
Ending Finished Goods = Beginning Finished Goods + COGM - COGS
Where:
- Beginning Finished Goods: The dollar value of finished inventory at the start of your measurement period
- COGM (Cost of Goods Manufactured): The total cost of all products you completed during the period
- COGS (Cost of Goods Sold): The cost of finished goods you actually sold to customers during the period
To calculate COGM, use this formula:
COGM = Beginning WIP + Total Manufacturing Costs - Ending WIP
This captures all costs associated with products that moved from work-in-progress status to finished goods status during your measurement period.
For a practical example, consider a manufacturer that started the month with $150,000 in finished goods inventory. During the month, they completed $200,000 worth of manufactured products (COGM) and sold $180,000 worth of finished goods (COGS).
Their ending finished goods inventory would be: $150,000 + $200,000 - $180,000 = $170,000
This calculation reveals that inventory increased by $20,000 during the month. This information prompts important questions: Was this increase intentional to prepare for anticipated demand, or does it represent overproduction that will tie up working capital? Should production be reduced next month, or does the sales pipeline justify maintaining this higher inventory level?
Regular calculation of finished goods inventory, ideally monthly, provides the foundation for making these strategic decisions based on data rather than intuition.
Try Controlata
- Manufacturing inventory management
- Cost calculation
- Production planning
- And much more

Common Pitfalls in Finished Goods Management

Overproduction to Achieve Economies of Scale
Many manufacturers fall into this trap: “We get better unit costs if we produce larger batches, so let’s manufacture more.” While this logic sounds appealing from a pure manufacturing cost perspective, it often creates more problems than it solves.
The reality is that holding costs frequently exceed the manufacturing savings achieved through larger production runs. When you produce 5,000 units to save $2 per unit in manufacturing costs but only sell 3,000 units in the next quarter, you’ve tied up capital in 2,000 units that may eventually require discounting or could become obsolete before selling.
A better approach aligns production schedules with actual demand signals from your sales pipeline, customer orders, and reliable forecasts. Just-in-time manufacturing principles and materials requirement planning (MRP) systems help manufacturers balance setup costs against holding costs more effectively.
Poor Demand Forecasting Accuracy
Manual forecasting methods typically achieve only 63% to 65% accuracy, according to industry research. This means roughly one-third of your demand predictions miss the mark, leading to either stock-outs that disappoint customers or excess inventory that consumes working capital.
The impact compounds over time. Inaccurate forecasts lead to production decisions that don’t align with market reality. You either scramble to produce rush orders when you underestimate demand or watch inventory accumulate when you overestimate it.
Modern solutions rely on historical sales data analysis combined with market trend monitoring and seasonal adjustment. Advanced manufacturers deploy artificial intelligence and machine learning systems that improve forecasting accuracy by 20% to 30% compared to manual methods.
Inadequate Tracking and Visibility
Manual inventory tracking systems lose accuracy progressively over time. Physical counts drift from system records due to transaction errors, shrinkage, damage, and miscounts. When your data quality deteriorates, you cannot make sound decisions because you’re working with incorrect information.
The alternative demonstrates dramatic improvement. Manufacturers utilizing automated tracking systems with barcode scanning, RFID technology, and IoT sensors achieve near-perfect inventory accuracy exceeding 99% in optimized implementations. This precision eliminates costly stockouts caused by inaccurate availability data while preventing excess inventory accumulation from unnecessarily large safety stock buffers.
Ignoring Product Lifecycle Stages
Different products require different inventory strategies based on their lifecycle stage. A one-size-fits-all approach to inventory management creates inefficiency.
New product introductions need higher inventory positions due to demand uncertainty and the strategic importance of satisfying early adopters. Mature products with predictable demand patterns can operate with leaner inventory levels and more frequent, smaller production runs. Products approaching end-of-life require managed inventory runoff to minimize write-offs from obsolescence.
Failing to adjust inventory policies based on product lifecycle stages results in either missed sales opportunities or excessive obsolete inventory write-offs.
Best Practices for Effective Finished Goods Management

Implement Data-Driven Demand Forecasting
Effective forecasting starts with historical sales data, ideally covering a minimum of 12 to 24 months. This timeframe captures seasonal patterns, trend lines, and cyclical variations that shorter periods might miss.
Factor in multiple variables beyond simple historical averages. Seasonality affects most manufactured products to some degree. Market trends in your industry, economic conditions, and competitive dynamics all influence future demand. Promotional activities and marketing campaigns create predictable spikes that your forecasts should anticipate.
Technology dramatically improves forecasting accuracy. Manufacturers implementing AI and machine learning forecasting systems report 20% to 30% accuracy improvements compared to manual spreadsheet methods. These systems identify patterns humans miss and continuously learn from forecast errors to improve future predictions.
Update your forecasts regularly. Monthly reviews represent the minimum acceptable frequency, while weekly updates better serve manufacturers in fast-changing markets or with short product lifecycles.
Establish Clear Inventory Policies
Document specific minimum and maximum inventory levels for each SKU based on demand patterns, lead times, and strategic importance. These policies prevent ad-hoc decisions driven by gut feeling rather than data.
Define reorder points that trigger production or procurement before inventory reaches critically low levels. Calculate safety stock requirements based on demand variability and lead time uncertainty rather than arbitrary percentages.
Document your decision criteria so different team members apply consistent logic when making inventory decisions. This standardization prevents the situation where one production planner maintains tight inventory while another builds excessive buffers.
Review and adjust these policies quarterly at minimum. Markets change, customer preferences shift, and what worked six months ago may no longer serve your business effectively.
Optimize Production Scheduling
Align production runs with actual customer orders whenever possible. Build-to-order approaches minimize finished goods inventory for customized or configurable products. Build-to-stock strategies work better for standardized products with predictable demand.
Batch production strategically by balancing setup costs against holding costs. Larger batches reduce per-unit manufacturing costs but increase inventory carrying costs. Smaller batches increase manufacturing costs but improve cash flow and reduce obsolescence risk. The optimal batch size depends on your specific cost structure and demand characteristics.
Leverage Technology for Real-Time Visibility
Modern inventory management systems provide instant visibility across multiple sites, enabling managers to monitor inventory positions, reallocate stock between locations, and optimize fulfillment routing in real-time through mobile and desktop interfaces.
The investment delivers measurable returns. Research documents that manufacturers implementing comprehensive automation solutions achieve 170% to 219% return on investment over three-year periods, with typical payback occurring within 12 to 18 months of deployment.
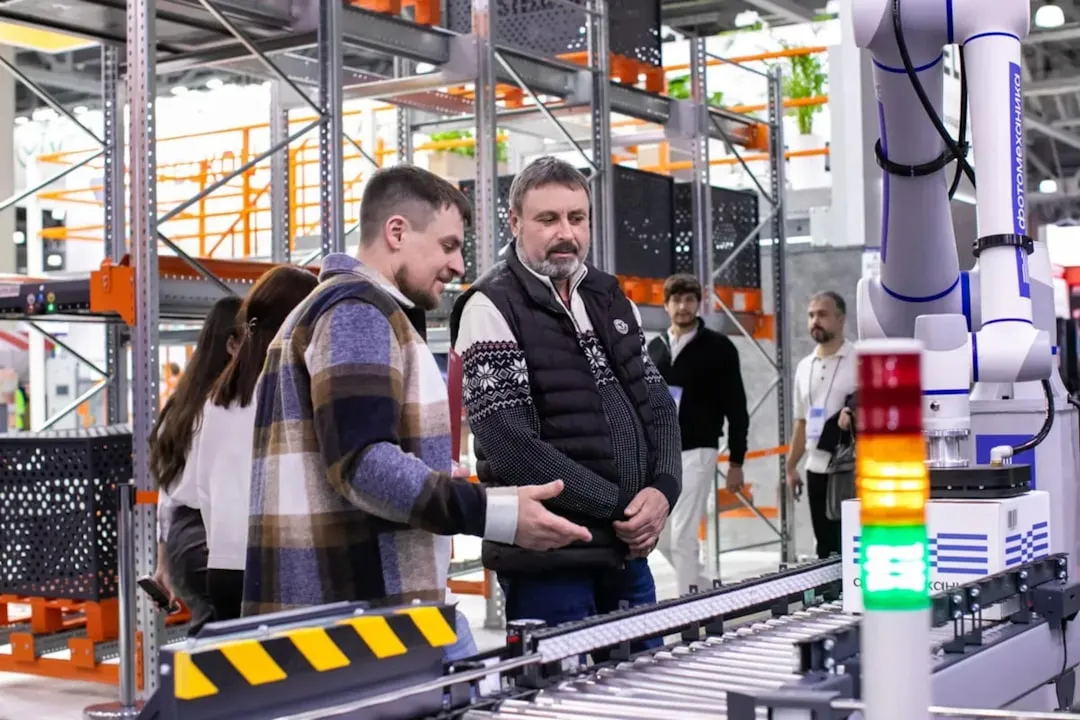
IoT sensors and RFID technology enable autonomous inventory tracking that updates counts automatically as materials move through facilities, eliminating manual transaction recording while enabling real-time visibility.
Monitor Key Performance Indicators
Track inventory turnover ratio, targeting 5 to 6 annual turns for manufacturing operations based on industry benchmarks. Higher ratios indicate more efficient inventory management and faster capital conversion.
Measure days sales of inventory to understand how long products sit before selling. Calculate your stock-out rate to quantify missed sales opportunities from inadequate inventory. Monitor carrying costs as a percentage of inventory value to ensure you understand the true cost of inventory investment.
Research demonstrates that manufacturers implementing automation improve on-time delivery performance by 25%, creating measurable customer satisfaction improvements.
Integrating Finished Goods Management with Broader Operations
Finished goods inventory does not exist in isolation. It connects directly to nearly every other aspect of your manufacturing operation, and managing these connections effectively multiplies the benefits of good inventory practices.
Production planning represents the most direct connection. Your finished goods targets should drive production schedules, not the reverse. When manufacturers schedule production based on manufacturing efficiency alone without considering finished goods implications, they create the overproduction problems discussed earlier. Effective integration means production planners receive regular finished goods inventory reports and adjust manufacturing schedules to maintain target inventory levels.
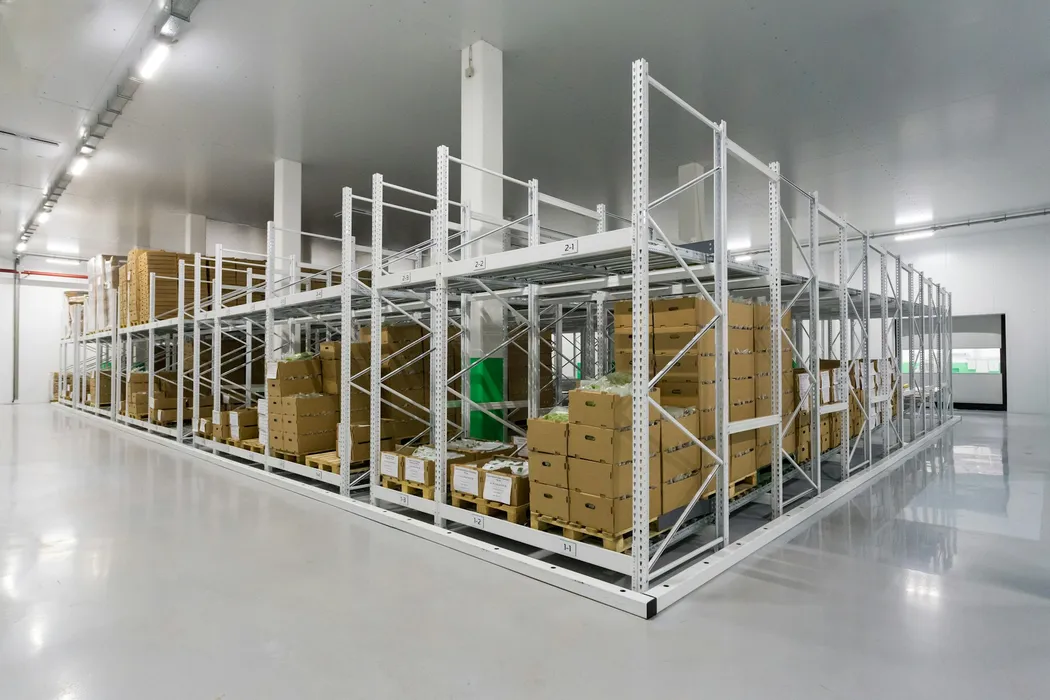
Warehouse space utilization depends heavily on finished goods management. Poor inventory planning forces warehouses to handle unpredictable volume swings, making efficient space allocation nearly impossible. Conversely, predictable finished goods levels enable optimized warehouse layouts and better space utilization.
Customer order fulfillment speed improves when finished goods inventory aligns with demand patterns. Research shows that real-time inventory tracking enables 30% faster order processing through immediate stock verification and automated fulfillment routing.
Financial planning treats finished goods inventory as a key working capital component. Your CFO needs accurate finished goods projections to forecast cash requirements, plan financing needs, and optimize capital deployment across competing priorities.
Supply chain coordination requires alignment between raw material procurement and finished goods targets. When these disconnect, you either face production delays from material shortages or accumulate excess raw materials that consume cash before manufacturing even begins.
Modern manufacturing systems like Controlata integrate these connections, enabling production planning that considers finished goods targets, raw material availability, and customer demand simultaneously rather than treating each as an independent variable.
Conclusion
Finished goods inventory management extends far beyond simple warehousing. It represents a strategic function that directly impacts cash flow, customer satisfaction, and competitive positioning. The manufacturers that thrive understand the critical balance between maintaining adequate availability and avoiding excessive capital tie-up. Start by calculating your current finished goods value, identify your biggest gaps whether forecasting accuracy, tracking visibility, or production alignment, and implement one concrete improvement this quarter. Long-term technology investments deliver measurable returns, with industry data showing 170% to 219% ROI over three years. Better finished goods management translates directly into improved cash flow and higher customer satisfaction. Tools like Controlata help manufacturers optimize finished goods management while integrating with broader production planning and inventory control systems.